

Open-source discovery has a measurement problem: popular repositories, maintained products, public-sector solutions, frameworks, and curated lists are often mixed into one “ecosystem” number. This report avoids pretending they are equivalent. It describes the composition of the OpenSourceChoice catalog as it existed on July 21, 2026, and publishes the calculation rules and gaps needed to interpret the results.
The snapshot contains 2,078 approved listings, each linked to a public source repository. Content and collaboration, data and analytics, and AI and machine learning together account for 56.9% of the catalog. Among the 1,083 listings with a recorded last-commit timestamp, 87.9% had a commit within the previous 90 days. That activity figure is encouraging, but the missing timestamps on 995 listings prevent a catalog-wide activity claim.
Key takeaways
- Three categories—content, data, and AI—represent 1,182 of 2,078 listings (56.9%).
- AGPL-family licenses are the largest normalized family at 414 listings (19.9%), narrowly ahead of MIT at 396 (19.1%).
- Every approved listing has a public source-repository link; 1,392 (67.0%) also have a recorded official website.
- 786 listings (37.8%) have an explicit proprietary-alternative mapping.
- Last-commit coverage is incomplete: 1,083 listings have a timestamp and 995 do not.
- Of the known timestamps, 952 (87.9%) fall within 90 days and 1,041 (96.1%) within one year of the snapshot.
- Country and EUPL distributions are influenced by the EU OSS Catalogue import and must not be read as global market share.
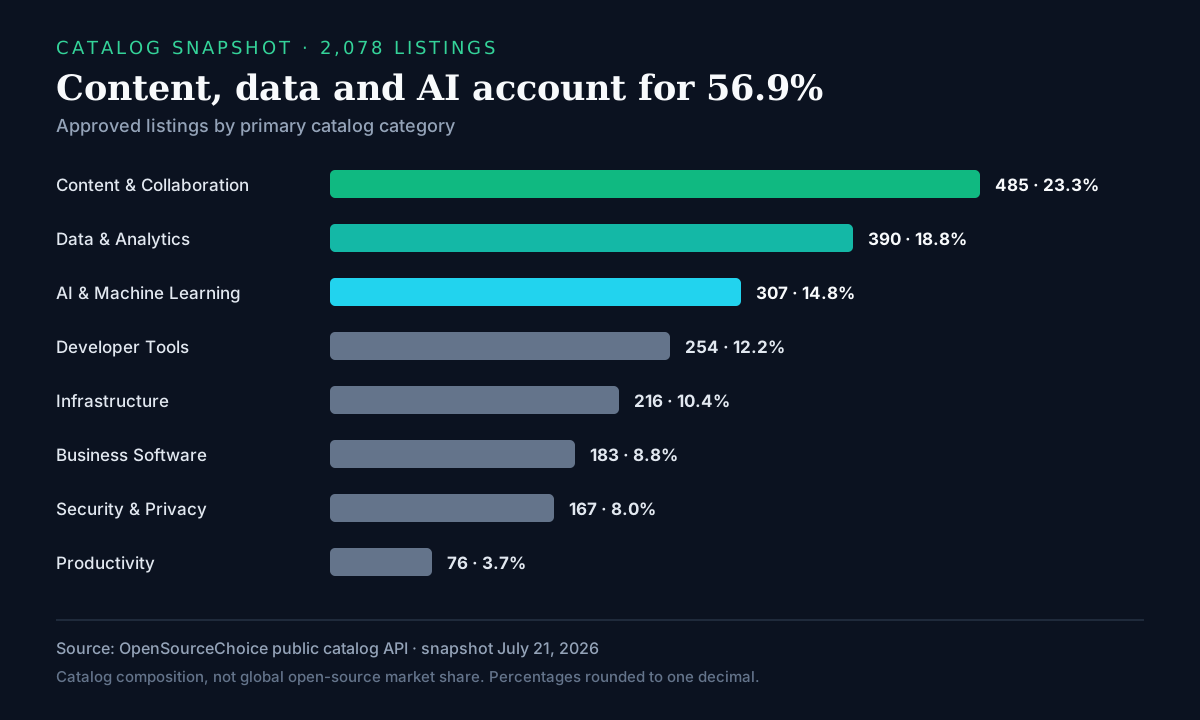
Category concentration
| Catalog category | Listings | Share |
|---|---|---|
| Content & Collaboration | 485 | 23.3% |
| Data & Analytics | 390 | 18.8% |
| AI & Machine Learning | 307 | 14.8% |
| Developer Tools | 254 | 12.2% |
| Infrastructure | 216 | 10.4% |
| Business Software | 183 | 8.8% |
| Security & Privacy | 167 | 8.0% |
| Productivity | 76 | 3.7% |
The top three categories contain 1,182 listings. That concentration reflects current catalog coverage as much as project creation: repository discovery is strongest where public development, technical documentation, and recognizable product alternatives overlap.
The smaller productivity count does not prove that open-source productivity software is scarce. Some productivity projects are classified under collaboration, business software, or developer tools, and a single primary category cannot represent every use case. Use category counts as a map of this catalog, not a market-sizing exercise.
License families
Raw license strings fragment the same legal family across identifiers such as AGPL-3.0, AGPL-3.0-only, and AGPL-3.0-or-later. We normalized only obvious identifier variants; we did not infer a license from repository content when the catalog field was missing.
| Normalized family | Listings | Share |
|---|---|---|
| AGPL family | 414 | 19.9% |
| MIT | 396 | 19.1% |
| Apache family | 335 | 16.1% |
| EUPL family | 305 | 14.7% |
| Unknown / NOASSERTION | 233 | 11.2% |
| GPL family | 195 | 9.4% |
| Other declared families | 200 | 9.6% |
The near balance between copyleft and permissive families is more useful than a simplistic “most popular license” label. Deployment and redistribution obligations depend on the exact identifier and version, not only the family. NOASSERTION also does not mean proprietary or unlicensed; it means this snapshot does not contain a reliable declared value. Verify the upstream LICENSE file and seek qualified advice for commercial distribution.
Repository activity: a strong signal with incomplete coverage
The catalog recorded a last-commit timestamp for 1,083 listings, or 52.1% of the sample. Within that covered group:
| Activity window | Listings | Share of known timestamps |
|---|---|---|
| Commit within 90 days | 952 | 87.9% |
| Commit within 365 days | 1,041 | 96.1% |
| Older than 365 days | 42 | 3.9% |
This supports a narrow conclusion: listings with known timestamps are predominantly active. It does not support saying 87.9% of all 2,078 projects are active, because 995 rows lack the required timestamp. Coverage itself is now a measurable quality target for the catalog.
A recent commit is also not a security or product-quality grade. Mature software can need fewer commits; a busy repository can still be unstable. Project pages therefore show activity beside license, releases, documentation, deployment fit, and upstream links rather than converting it into a universal score. Examples such as Prefect, Temporal, and Vue.js should be evaluated from their individual evidence, not this aggregate.
Product discovery coverage
All 2,078 approved listings contain a public source-repository link because that is an approval requirement. Two other fields are less complete:
- 1,392 official websites (67.0%) make it easier to separate product documentation and positioning from repository metadata.
- 786 explicit alternative mappings (37.8%) connect a project to a proprietary product or familiar problem space.
These are coverage figures, not product-quality figures. A library may not need a marketing website or proprietary comparison. Conversely, a product positioned as an alternative should have enough upstream evidence to support that mapping. The catalog keeps the repository visible so readers can verify the claim.
Why country figures need a warning label
The snapshot contains 496 listings attributed to Italy and 376 to Germany—far more than any other recorded country. This is not evidence that those two countries produce most of the world's open-source software. OpenSourceChoice federates public-sector records from the official EU OSS Catalogue, which deliberately increases European public-administration coverage and also helps explain the large EUPL family.
Country values may describe the organization, public authority, or documented origin represented by an upstream catalogue record. Missing country data is not replaced with a guess. Country pages are therefore useful for discovery inside this dataset, but unsuitable for country league tables or economic comparisons.
Methodology
The analysis used the public OpenSourceChoice lightweight catalog API on July 21, 2026. Calculations were made at the approved-listing level after the catalog's existing project identity and deduplication rules had been applied.
- Count all approved listings in the returned snapshot.
- Group the single catalog category recorded for each listing.
- Normalize only clear variants of MIT, Apache, AGPL, GPL, and EUPL identifiers; retain
NOASSERTIONas unknown. - Count last-commit windows only when a timestamp exists, using April 22, 2026 for 90 days and July 21, 2025 for one year.
- Count official websites and proprietary-alternative mappings only when the corresponding field is populated.
- Report country values as catalog composition and disclose EU OSS federation bias.
The public methodology and editorial accountability rules are maintained on the About and ranking methodology page.
Limitations
- The catalog is curated and continuously updated; it is not a census of every open-source repository.
- Listings include products, frameworks, developer tools, public-sector solutions, and some resource collections. Counts should not be treated as identical commercial products.
- Category and tag assignment can be inferred from public metadata and may lag a project's current positioning.
- Commit timestamps are missing for 995 listings and may lag the upstream repository.
- Stars, forks, and commits are adoption or activity context, not independent proof of quality, security, or fitness.
- The EU OSS Catalogue enriches European public-sector coverage, affecting country and license distributions.
- Percentages are rounded to one decimal place and may not sum to exactly 100%.
What we will track next
Future quarterly snapshots should prioritize comparability over adding more headline metrics. The most valuable changes are last-commit coverage, official-website coverage, explicit alternative evidence, and category drift. A stable archived snapshot will also make quarter-over-quarter changes auditable instead of silently replacing the baseline.
We will not publish a universal “best open-source project” score. Different readers need different deployment, license, security, governance, and migration trade-offs. The report's job is to expose the shape and quality of the evidence available for those decisions.
Official sources & further reading
- OpenSourceChoice public catalog snapshot — row-level source used for the July 21, 2026 calculations.
- OpenSourceChoice methodology — ranking, editorial ownership, automation, corrections, and evidence boundaries.
- EU Open Source Solutions Catalogue — official federated catalogue used for public-sector enrichment.
- About the EU OSS Catalogue — scope, federation model, and participating catalogues.
- SPDX License List — official identifiers used to interpret declared license strings.
Build a stack for this use case.
Answer nine practical questions and compare three transparent architectures with costs, free limits, lock-in, and migration paths.
Build my stack